Your operation is one living system.
Five Diagnostic Domains
We measure all of it.
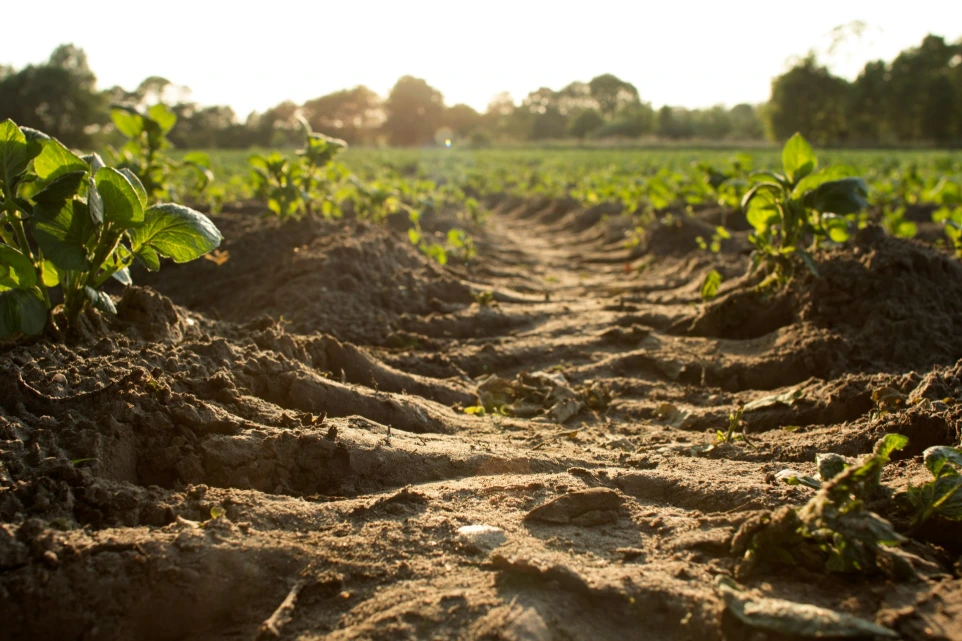
Ground
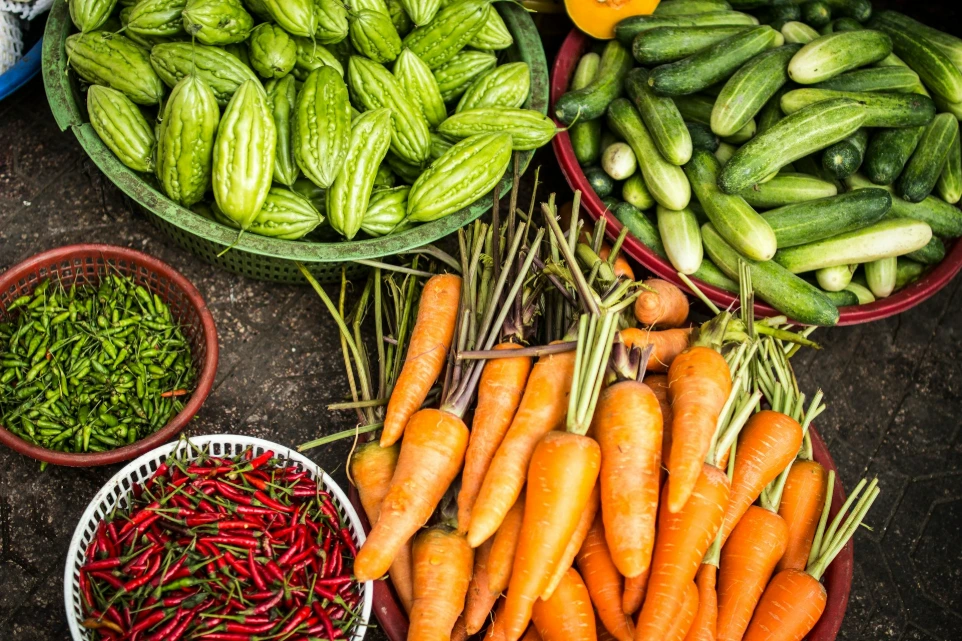
Crop

Livestock
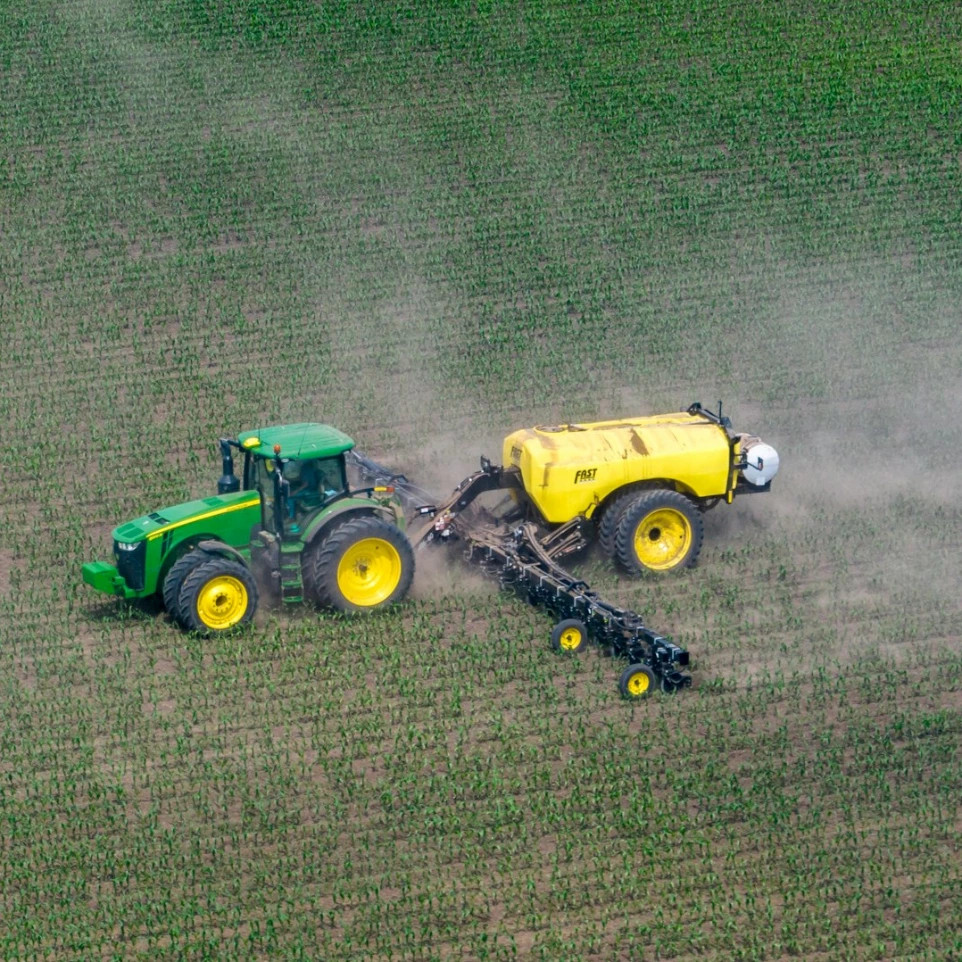
Inputs
Invasives
Tests bundles built for your operation
Example A
Ground + CropRow crop baseline
Example B
Livestock + Ground + Inputs
Cow-calf or mixed operation
Example C
Ground + Crop + Inputs + Invasives
Specialty / orchard
A report you can actually use.
The one-page summary. Field map, sampling design, baseline metrics, risk tier across the operation. The page you can sit down with at the kitchen table and see your whole farm at once.
The full baseline picture across every field. Soil chemistry, biology, water, plant tissue, sap, and pressure. The data the rest of the program gets built around.
The five diagnostic domains, each broken out with measured values, reference ranges, deviation flags, and operational interpretation. What it means, what it costs you, and what to do about it.
The ROI section. What this is costing you per acre right now in yield drag, wasted inputs, and missed potential. What fixing it would cost. What payback looks like over one season and over three. Built in your operation's terms, not abstract numbers.
The cross-domain story. Where soil chemistry is limiting biology. Where biology is limiting nutrient cycling. Where the input program is undercutting itself. Why your field is doing what it's doing in plain language, with the data behind it.
The intervention recommendations. What to adjust, in what order, on what timeline. Specific. Sequenced. Built for your goals and your operation.
The multi-year picture. What we expect to move season to season. What thresholds trigger program adjustments. What yield, quality, and input cost trajectories look like if the program runs to plan. Set up so you can hold us to our predictions.
What Comes After
Once we know what's there, we can design for a deeper fix.